- Relay with Kyla Ronellenfitsch
- Posts
- Who the f is going to vote???
Who the f is going to vote???
Taking a peek at different turnout scenarios
Kyla Ronellenfitsch
February 26, 2025 • Estimated Reading Time: 6 minutes
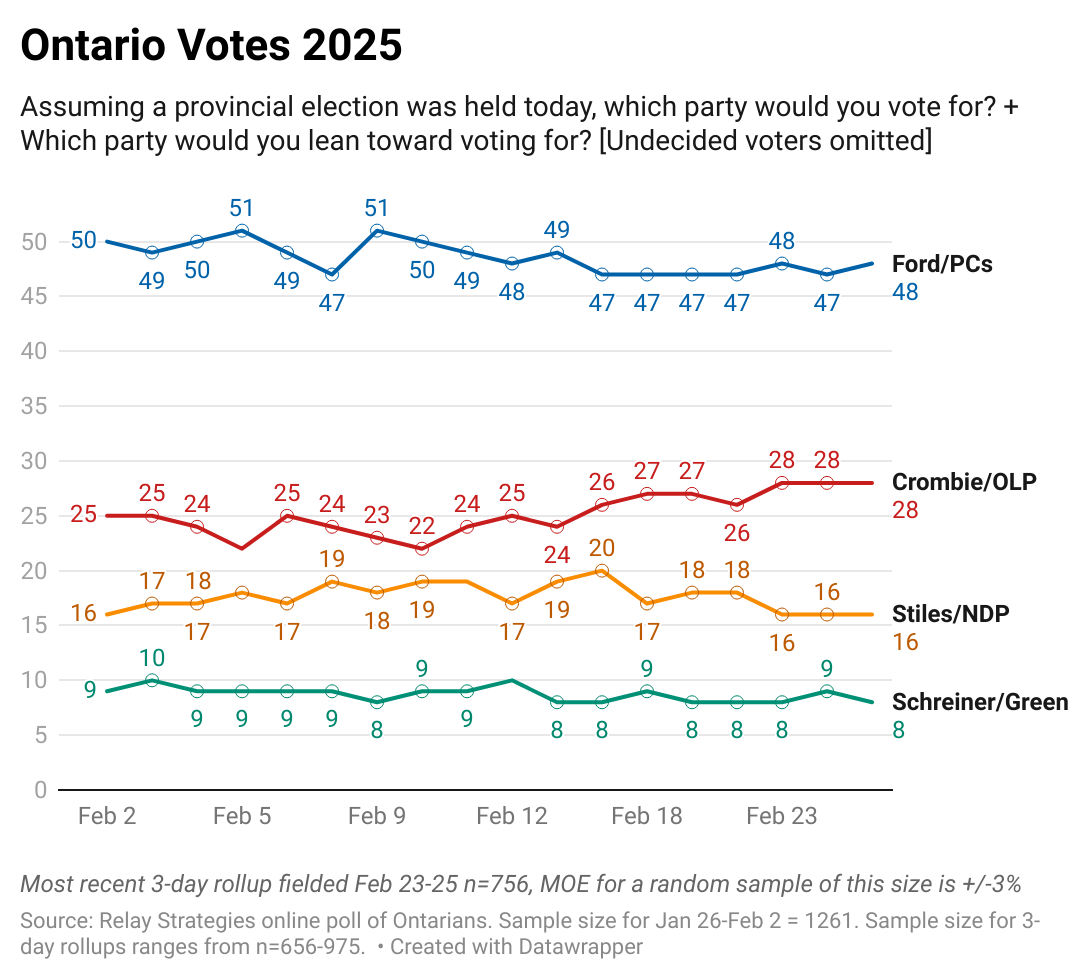
Alright, Ontario, we’ve made it to the end. Election Day is TOMORROW. Let me first say - thank you so much for following along. I’d say that we’ve had our highs and lows but… no, we haven’t!! That’s the whole story of the campaign.
The vote is statistically the same as yesterday and the day before that. The PCs are polling at 48%, OLP 28%, NDP 16%, and Greens 8%.
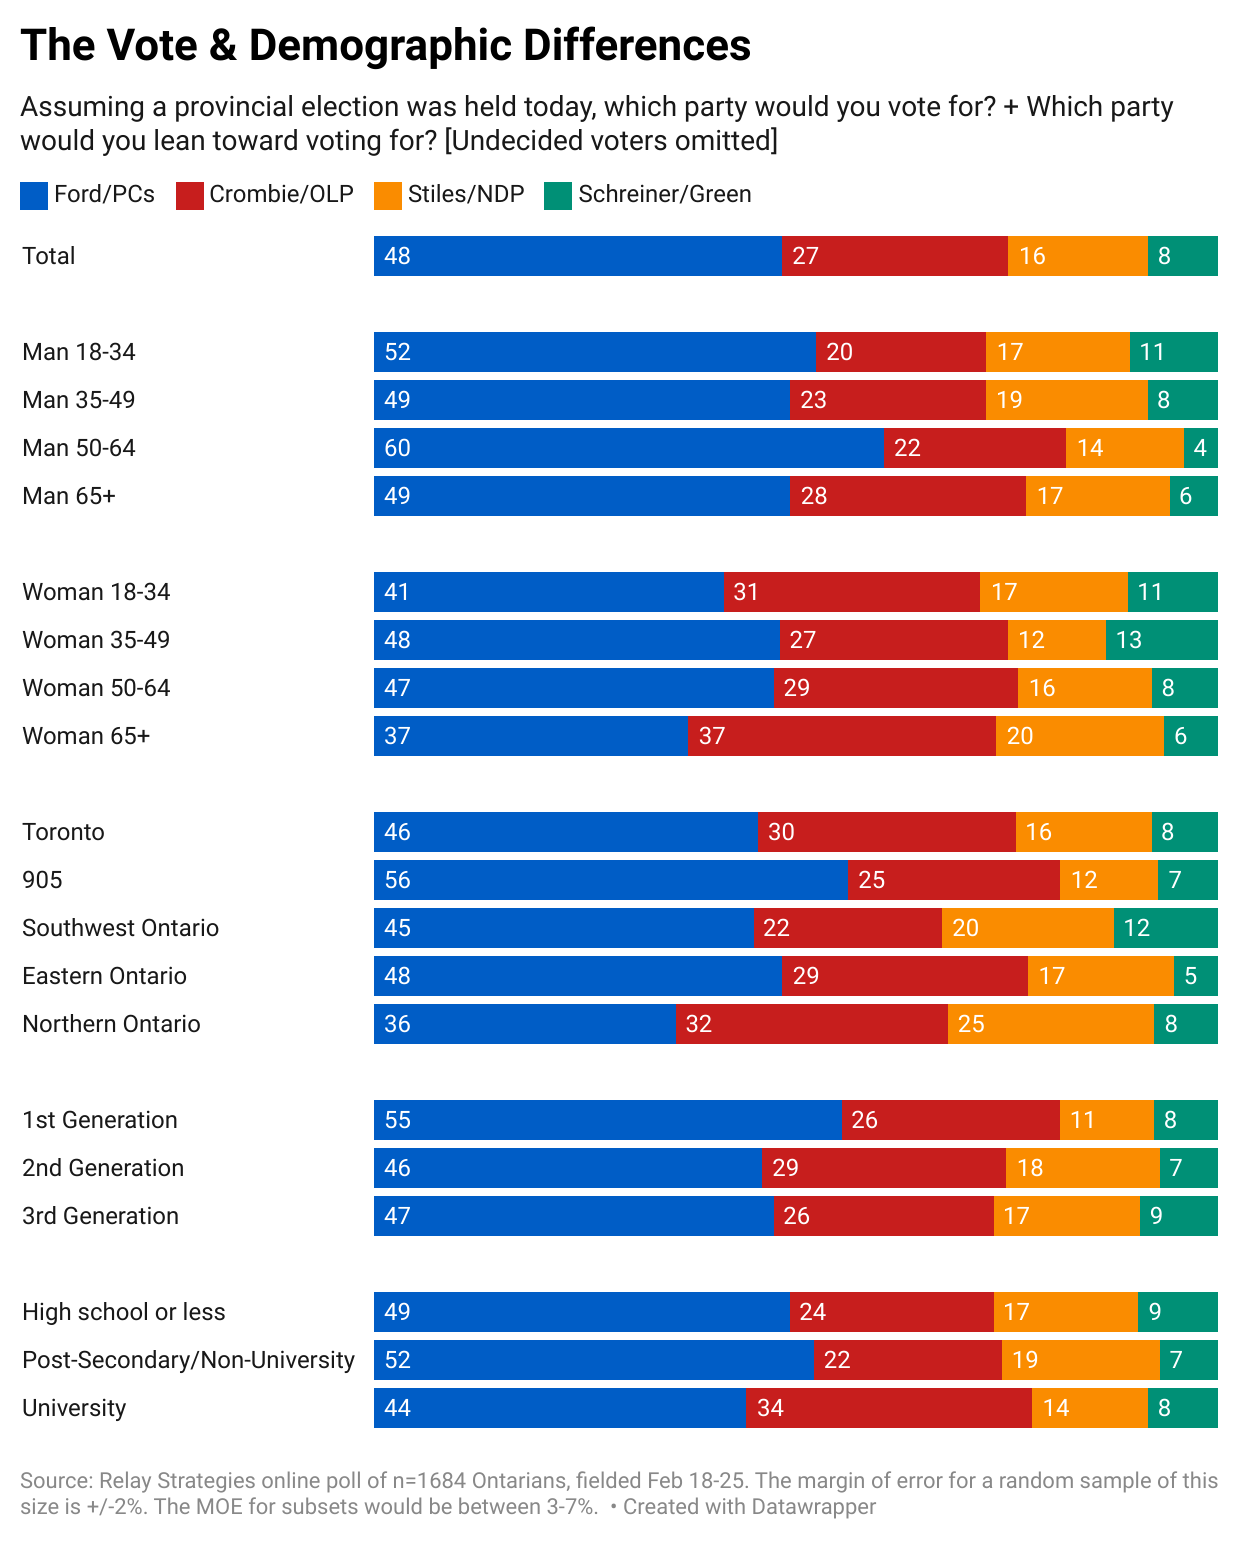
I rolled up this past week’s data so we can look at demographic differences. If this was an election held only among women older than 65, then we’d have a race! The PCs and Liberals are tied among that group. In every other gender x age cohort, the PCs are winning by substantial margins. This is especially the case among men younger than 65. The PCs are winning in every region but the north, where all three parties are competitive (within the MOE). The Fords have always had a special relationship with 1st Generation Canadians, and the PCs poll especially well with that group. The Liberals are disproportionately supported by university-educated Ontarians, but the PCs still lead in every education group. The Greens’ strength comes from young men, women younger than 50, and Southwest Ontario.
One of my big gripes with the polling industry (I have a few) is that too often, results are framed as, “this is what’s going to happen,” as opposed to “this is what could happen.” To go on a very meta rant about trust–I have spent 11 years conducting research for clients who are fundamentally trying to understand, “How do I get people to trust me enough to believe what I’m saying.” To sum up my findings: nuance and humility > declaration and bluster. Discussing what we know and don’t know actually helps to build confidence. Saying this is true because I said so, destroys it. I try to apply these learnings to my own work.
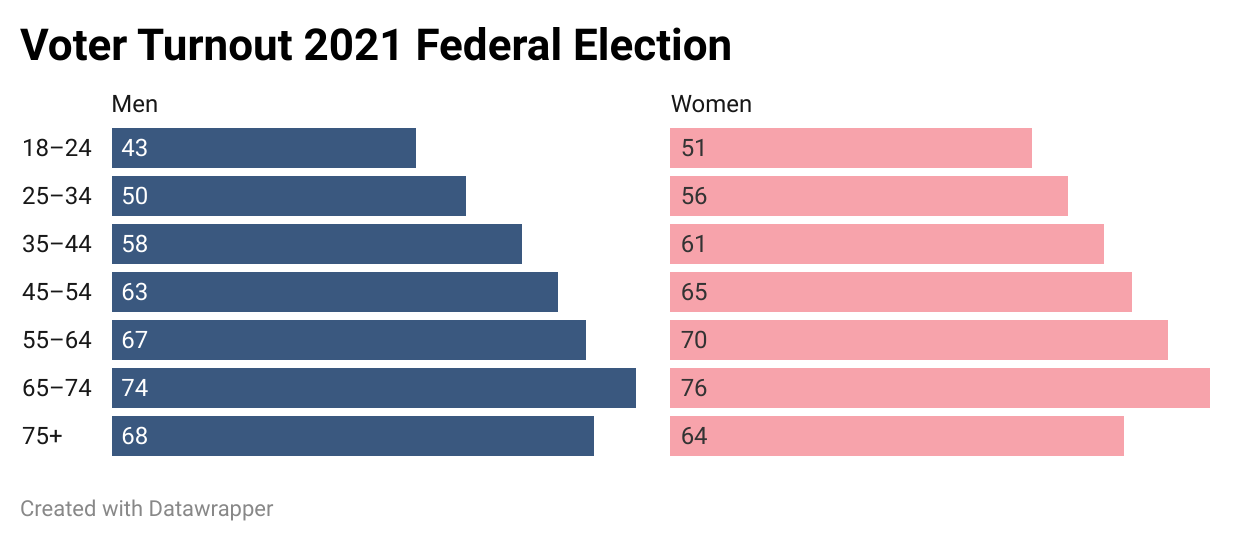
As I discussed yesterday, voter turnout is the big unknown variable in this campaign. In the last Ontario election, voter turnout was just 43.5%, and while the window for advanced voting was much shorter this election, voters didn’t show up in droves (6%). And even with the last election’s dismal voter turnout, there was a lot of variation across the province. Ridings that voted at higher, but not high, rates tend to be a little older, a little whiter, and a little more affluent. Conversely, many of the ridings with the lowest voter turnout are in the ever-important 905 or Toronto and are more diverse.

Elections Ontario doesn’t publish great voter turnout data, but if we look at federal numbers, we see very dramatic differences by age and gender, with young men being especially unlikely to vote. While all of this is very imprecise, it gives some good hints as to who is more inclined to turnout.
I mapped out three different turnout scenarios to see the range of outcomes we’re working with. The first is my original numbers, weighted to be representative of the Ontario population. The second is weighted to the 2021 gender x age turnout proportions. Basically, I weighted down young people and weighted up older Ontarians. Lastly, I looked only at the slice of voters who self-report that they’re very likely to vote or already have.
Weighted to 2021 gender x age proportions, we’re pretty much looking at the same race. The OLP vote increases by 1 point, and the PCs lose 1. This would, however, make a pretty big difference in seat count. Philippe Fournier, the author of 338Canada was kind enough to plug these three scenarios into his seat project model.
With the PCs at 48%, they would get approximately 104 seats, the Liberals would get 12, the NDP would get 6, and the Greens would get 2. This would have the Liberals exactly at official party status.
With the PCs at 47%, this split would be approximately 99 - 18 - 5 - 2. The OLP would be comfortably an official party.

If we look only at voters who I classify as extremely motivated to vote based on self-reporting, then the PCs are at 43%, Liberals at 31%, NDP at 19%, and Greens at 8%. In this scenario, the PCs would still have a big majority (78 seats), while the OLP and NDP would each have 22 seats. Talk about NDP vote efficiency!
These “extremely motivated” voters make up 49% of the population and include those who have already voted OR say they will “definitely” vote AND rate themselves a 10/10 on voter motivation AND know where to vote. This isn’t meant to be a likely voter model, it’s more like a stand in for one. With more elections under Relay’s belt and more data to train from, I hope to eventually build a model that I feel confident in, but I’m not there yet. It does, however, give some inclination of how the actual vote could shift – to the OLP and NDP and away from the PCs.
I have to admit that while I’m not hyped about the Ford Super Majority 3.0, the fact that this is not a close race does make me feel like I will do less paper-bag breathing while watching the results come in. For that, I’m grateful.
I’m heading to Mexico City on Friday to celebrate moving into a new age bracket (IYKYK). I’ll be busy becoming 1 part margarita and 1 part chilaquiles, so I probably won’t write again until later next week.
Don’t forget to vote!
Reply